![3_Transparent_Image_footer.png]](https://novineer.com/hs-fs/hubfs/3_Transparent_Image_footer.png?height=32&name=3_Transparent_Image_footer.png)
Visually comparing the effects of printing orientation, toolpath and materials on structural performance.
The Compare tool lets you visually compare the results of two simulations side by side. Once you finish a simulation, open a second one by clicking the Compare results button under the Simulation tab. This opens a comparison panel with two viewers: the results of the current simulation are placed in the left-hand viewer and the second simulation on the right.
The Compare feature can be used to compare simulation results for any variation of part orientation, toolpath strategy, loading case, material or geometry.
Click Exit Compare to leave the comparison panel and return to your original simulation.
Setup steps
- Click the Compare results button under Simulation.
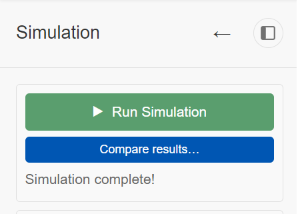
The Compare results button under the Simulation step.
- Click Open other project and provide the .noviproj file of the other simulation (The project bundle and its files).
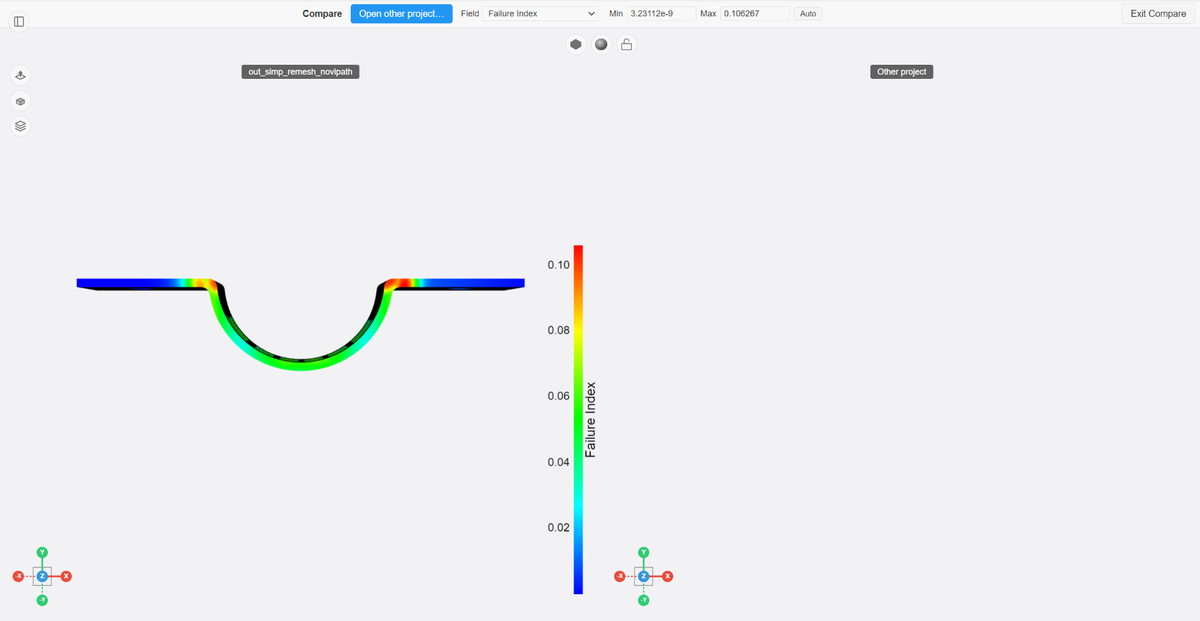
The comparison panel after opening the other project.
- Select a field from the drop-down.
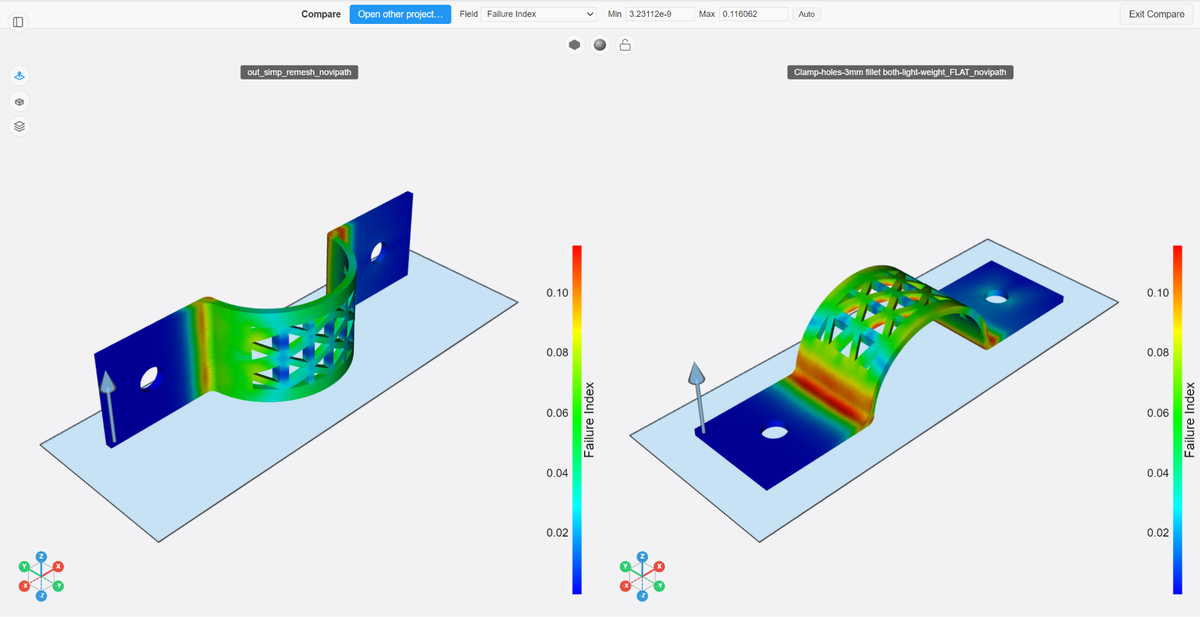
Selecting the field to display in both viewers.
- When you are finished viewing and analyzing, click Exit Compare to return to your original simulation.
Note: While the Compare panel is open, actions taken on the other panels, such as Meshing or Simulation, take effect but are not visible until you exit Compare.
Locked views
In contrast to the regular viewer, the Compare tool has two additional lock buttons. The Lock views button lets you rotate, zoom and pan the left and right views in tandem. The Lock layer sliders button lets you move up and down the printed layers in lock step between the left-hand and right-hand simulations.
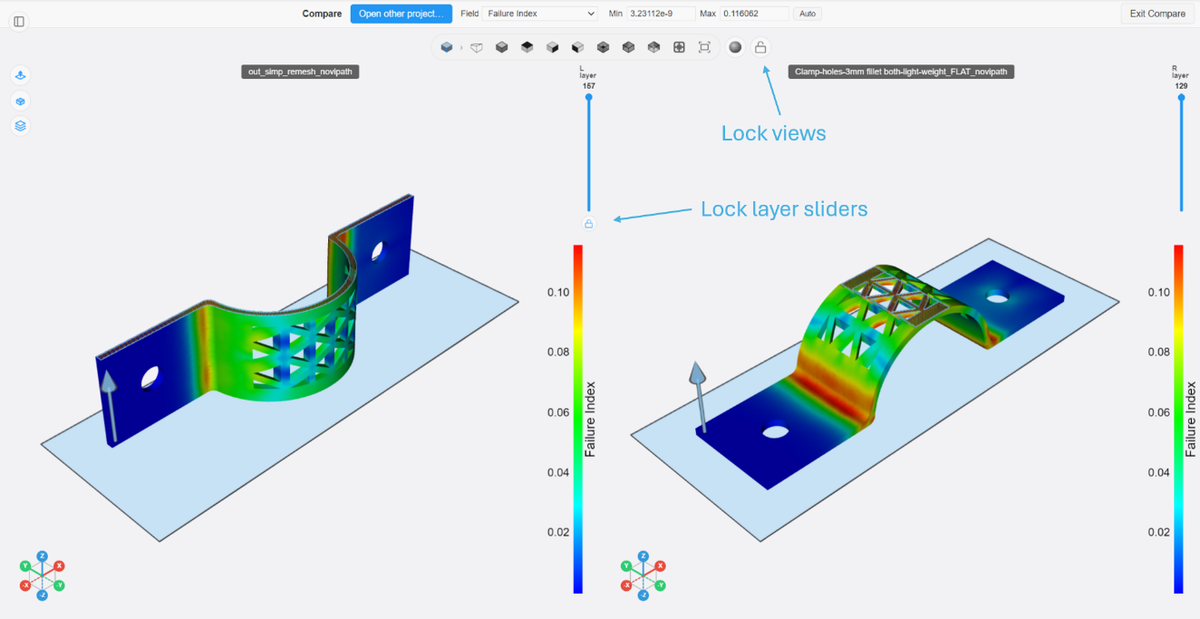
The Lock views and Lock layer sliders buttons.
The Field drop-down displays any of the available field quantities, including stresses and displacements. Both simulation views use the same scale, allowing a direct comparison of the differences.
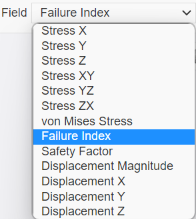
The Field drop-down.

Both views share the same Min and Max range.
Use the Show loads and restraints button to display your loads. This is helpful when you are comparing the effects of different load directions or magnitudes.
The Show loads and restraints button.
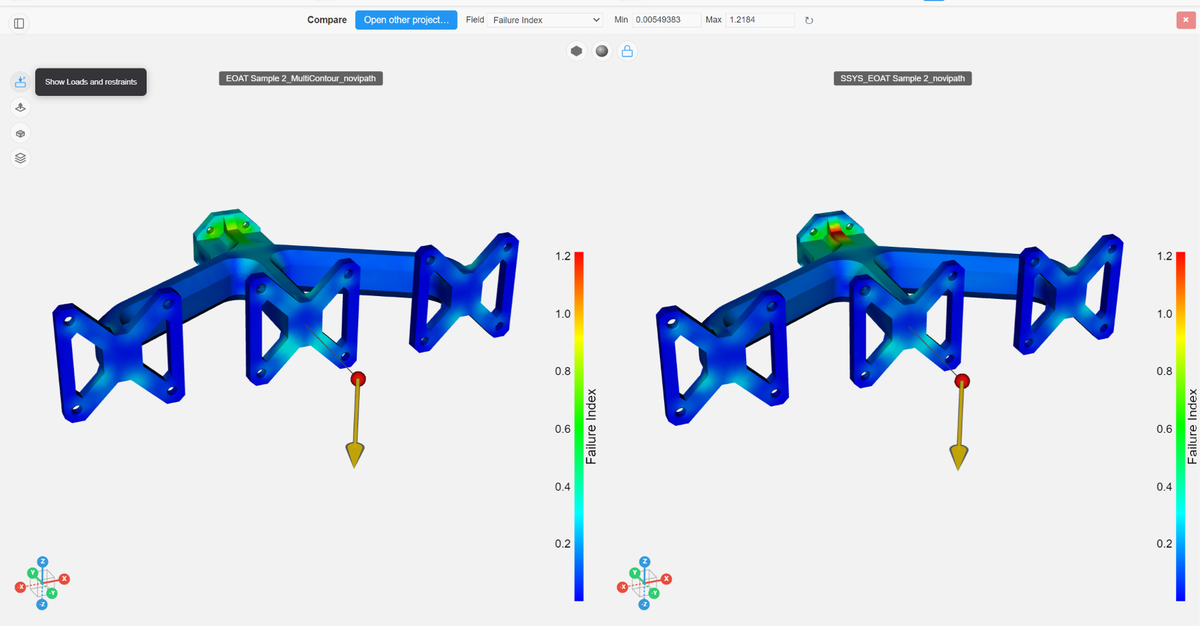
Two simulations compared with their loads and restraints shown.
See also Reading your first result and The deformation scale slider.